A Snapshot of Nepal’s Female Literacy Rate
Adult literacy rates in Nepal have increased and continue to increase, though similar countries have seen stagnation. The UNESCO Global Education Monitoring Report highlights under Sustainable Development Goal 4.6.2 that Nepal’s has seen growth in the adult literacy rate of women aged 20-34. UNESCO’s Education Progress Tool assesses this positive outcome as a result of literate young girls becoming adults. This blog will include other possible factors for Nepal’s efforts and successes to meet the literacy needs of its citizens.
UNESCO indicates that Nepal is the only country analyzed that has held sustained improvement over time. UNESCO attributes the success of Nepal to the simple explanation that young women, who have previously benefitted from increases in primary education access and promotion rates, are now growing up and positively effecting Nepal’s adult female literacy rates. I contend that if this argument were a full explanation, it would be seen in other countries as well who have had similar timelines of educational progress. Instead, I argue the figures provided are an indication of Nepal’s success in targeting women’s need for literacy by appealing to the social and emotional needs of their female population. Additionally, Nepal’s sustained literacy success is a reflection of the economic growth in the capital, Kathmandu and may be an indication that the rural populations continued educational struggles are not being addressed.
In 1994, female literacy rate in Nepal was only 25 percent in comparison to the male literacy rate of 55 percent. In an effort to mitigate these issues, His Majesty’s Government of Nepal and Save the Children US began implementing “Education for All” initiatives which, along with help from local non-governmental organizations, have worked to steadily decrease the illiterate population. In the UNESCO country data for Nepal an interesting data set indicates that literacy programs since 1994 have been successful for in targeting female participants specifically. This data shows the increase in literacy rate for females aged 15-24 years has increased from 14.97 per cent in 1981 to 90.88 per cent in 2018, with the most drastic increase coming between 1991 and 2001, from 32.67 per cent to 60.14 per cent in 2001 due to the new policies that were established in 1994.
In Nepal, there has been an effort to increase integrated literacy programs where literacy is taught in several different contexts and so it can be accessed at different stages in one’s everyday routine. There are literacy education programs being provided to adult women by religious institutions, aid organizations and public institutions. These programs take a holistic approach to education by taking into account a woman’s education while also assessing the other areas of their lives such as health, children, income etc. In Nepal, a research group called The Goals and Purposes of the Girls’ and Women’s Education Initiative and the Girls’ and Women’s Education policy Research Activity (GWE-PRA) followed two of these groups, Basic Primary Education Project (BPEP) and the Health Education and Adult Literacy (HEAL) Program. The analysis found that woman who participated in these programs gained 13 percentage points over women who did not participate in the index of women’s social and economic development. (Burchfield et. al., 2002) By taking the woman’s full scope of life into consideration, literacy is able to be framed as a solution for the women participating in these programs. The success of these programs is attributed to their ability to meet a broad scope of needs for the female participants that went beyond their literacy studies. Nepal’s efforts to tackle the entire problem, instead of simply one part of the whole, had shown to be an indicator of why they have been able to sustain their growing literacy rates.
The data point provided by UNESCO’s Education Progress Tool does not show the full picture of the continued effort to achieve high literacy rates in Nepal. The country still suffers from drastic economic inequalities between rural and urban populations that are shown in the education-based data as well. Nepal’s rural populations makes up 80 per cent of the total population and yet there are reports that students are not able to find or access education past the primary level in the poorest areas of the country. (Khatimada, 2015) The picture of Nepal’s female literacy rate process shows sustained success over time. These figures are slow to change over time and require continued work. If Nepal is able to continue working towards meeting the education as well as the social and emotional needs of its female population, it will continue to see sustained growth in its female literacy rates.
References
Acharya, S., Yoshino, E., Jimba, M., & Wakai, S. (2005). Empowering rural women through a
community development approach in Nepal. Community Development Journal, 42(1), 34–46. doi: 10.1093/cdj/bsi064
Burchfield, S., Hua, H., Baral, D., & Rocha, V. (2002, November 30). A Longitudinal Study of
the Effect of Integrated Literacy and Basic Education Programs on Women’s Participation in Social and Economic Development in Nepal. Retrieved April 12, 2020, from https://eric.ed.gov/?id=ED475610
Comings, J. P., Shrestha, C. K., & Smith, C. undefined. (1991, November 30). A Secondary
Analysis of a Nepalese National Literacy Program. Retrieved April 12, 2020, from https://eric.ed.gov/?id=EJ446350
GEM Report Education Progress. (n.d.). Retrieved April 10, 2020, from https://www.education-progress.org/en/articles/learning/
Khatiwada, B. (2015, December 20). Children in Chitwan deprived of education past primary level. Retrieved April 12, 2020, from
Manandhar, U., & Leslie, K. (1994). Empowering Women and Families Through Literacy in Nepal. Toronto, 27(2).
Nepal. (2017, April 12). Retrieved from http://uis.unesco.org/en/country/np
Robinson-Pant, A. (2000). Women and literacy: a Nepal perspective. International Journal of Educational Development, 20(4), 349–364. doi: 10.1016/s0738-0593(99)00080-2
Afghanistan’s Dip in Quality Education

Photo Credit: Nathalie Lahire/ World Bank
Background
Over the last four decades, Afghanistan has suffered from continuous wars that have devastated the lives of many civilians. During the 1980s, over a million Afghans lost their lives, and forced millions more to flee to neighboring countries and seek refuge. When Soviet forces withdrew their troops in 1989, conflict ensued with civil strife between the Taliban, an Islamic political and military movement, and the government. Much of the fighting was exacerbated by ethnic conflict which left many Afghans internally displaced, resulting in loss of education and employment (Independent High Commission on Education for Afghanistan, 2003, p. 29). Moreover, when the Taliban toppled the government in 1996, girls and women were denied access to healthcare, employment and education (UNICEF, 2003, p. 6). Following the fall of the Taliban five years later, much of Afghanistan’s infrastructure had been destroyed. In response, the government decided to rebuild the country’s education system from the ground up.
According to a 2003 report, much of the government’s approach during the twentieth century was conventional in the sense that only a limited portion of government actors were involved in policy making. Furthermore, segments of society were not always represented when it came to decision making (Independent High Commission on Education for Afghanistan, 2003, p. 30). However, at the turn of the century, Afghanistan had shifted from a traditional hierarchical power structure to become more inclusive.
Implications
Today, despite the catastrophic circumstances and reoccurring violence, Afghan society recognize the value in education as a “bridge that transforms an emergency situation into one of hope and promise” (UNICEF, 2003, p. 2). Education has unified the country, with the government of Afghanistan utilizing quality education as the foundation for poverty reduction and economic growth (Independent High Commission on Education for Afghanistan, 2003, p. 1). The idea of a good quality education includes “cultural diversity, multilingualism in education, peace and non-violence, health education and sustainable development (Independent High Commission on Education for Afghanistan, 2003, p. 108).”
There has been a vast improvement in Afghanistan’s educational system over the years. One example is the Strengthening Education in Afghanistan (SEA) program, a USAID initiative, which provided teacher training to over 4,500 teachers in 2018 (Fippin, 2019). However, many citizens are still not receiving a quality education, and only half of the population between the ages of 15 and 24 are literate (Fippin, 2019). Furthermore, in addition to lacking quality resources, teachers and trainers are not well-equipped to handle the large class sizes endemic to Afghan classrooms.

Another issue that affects students seeking a quality education is the disproportionate ratio between teachers and students. As depicted in the graph to the left, in 2018 the average ratio was 44 students to one teacher (“GEM Report Education Progress,” 2020). The spike in the graph, where the student-teacher ratio was nearly 60:1 reflects the attitude towards education during the Taliban’s five-year rule. Frequently, teachers were threatened or attacked and schools were bombed, treating these institutions as military targets rather than a place of learning (Barr, 2017). To this day, Afghanistan still suffers from a deficit of teachers, presenting immense challenges to delivering quality education.
Afghan children still face an abundance of barriers in accessing decent education in both urban and rural areas. Safety hazards which stem from poor infrastructure is a major concern that can inhibit student learning (GEM Report Education Progress, 2020). According to the World Bank, “around 70% of public schools lack clean drinking water and working electricity” (Molina et al. 2018, 7). Additionally, there is a lack of available sanitation for students to use. UNESCO observes that only 31% of primary schools have access to single-sex bathrooms.
| Low qualification of teachers and inadequate learning environments contribute to low-learning outcomes, with the teacher force remaining generally underqualified (World Bank, 2018) |
Reach and Impact
It’s not all grim though. While the disruption of war has impacted millions of young Afghans, a collaborative approach has been put forth to increase access to education. Since 2002, the Ministry of Education has taken initiative and embarked on a national ‘Back to School’ campaign. With the help of international donors, they launched a campaign which opened up its doors to get more than 3 million children—1/3 of them girls—enrolled in school again.
As of April 2017, a Ministry of Education official told Human Rights Watch that there are 9.3 million children in school, 39 percent of whom are girls. However, it is important to note that claims from the Afghan government regarding the number of students who have received an education post-2001 invasion is frequently disputed (Barr, 2017). The reasons for doubt are fair —the Afghan government is described as having “centralized, though typically weak, state control and often low-capacity, locally governed institutions” (Molina, Trako, Hosseini Matin, Masood, & Viollaz, 2018, p. 9). There seems to be a disconnect between student learning objectives, and which offer the opportunity for teachers to advance in their career despite lacking certain qualifications and seniority. Though there has been significant progress over the past 16 years, more attention needs to be centered towards the performance and quality to maximize potential student learning outcomes.
References
Barr, H. (2017). “I won’t be a doctor, and one day you’ll be sick”: Girls’ access to education in Afghanistan. New York, N.Y.: Human Rights Watch.
Fippin, E. (2019, July 20). Top 10 Facts About Education in Afghanistan. Retrieved from The Borgen Project website: https://borgenproject.org/top-10-facts-about-education-in-afghanistan/
GEM Report Education Progress. (2020). Retrieved from GEM Report Education Progress website: https://www.education-progress.org/en/articles/quality/
Independent High Commission on Education for Afghanistan (Ed.). (2003). The Revival and development of education in Afghanistan: Policy, objectives and strategies. Kabul: Independent High Commission on Education for Afghanistan.
Molina, E., Trako, I., Hosseini Matin, A., Masood, E., & Viollaz, M. (2018). The learning crisis in Afghanistan. Policy Paper. World Bank, Washington, DC.
UNICEF (Ed.). (2003). Rebuilding hope in Afghanistan. Retrieved from https://www.unicef.org/publications/index_15520.html
World Bank. (2018). Afghanistan: Promoting Education During Times of Increased Fragility. Retrieved from https://www.worldbank.org/en/country/afghanistan/publication/afghanistan-promoting-education-during-times-of-increased-fragility
Quality in the classroom: A peek into Peru’s approach

What we’re talking about:
How teachers contribute to the quality of education in Peru. According to UNESCO’s latest data set in the Global Education and Monitoring Report, 94.7% of all teachers in Peru have received official training in education. This data point arguably reflects the quality of education provided to the students.
How do they measure this?
The training of teachers looks vastly different across the globe; therefore, UNESCO’s definition of “trained” ranges from a full degree in education to a certificate in pedagogical, professional, and content knowledge. The wide variety of certificates and degrees makes teacher training the least comparable indicator in the SDG 4 monitoring framework.
Let’s put this in context of Peru.
In 2007, the Peruvian government required teachers to take a competency exam with the expectation that the scores would prove the need for teacher training. The test scores were later published in the newspapers and the National Teachers Union had reason to believe that the scores would be leveraged to fire instructors. The tension between the two parties have remained and prevented the government from spearheading any educational research.
Furthermore, in 2009, Peruvian students took the PISA and collectively ranked at the bottom out of 65 other countries. In another round of testing in mathematics and reading comprehension, only 30.9% of students reached the expected level in reading and 12.8% in math. These scores in conjunction with the outside push for universal free primary education put pressure on the Peruvian schools and government which they were not prepared to meet.
Some educational policies were passed that followed a structure focusing heavily on inputs. In 2010 one initiative spent $225 million to provide 860,000 laptops to schools across the country. Other initiatives provided textbooks, technology and other materials to students for little or no cost; however, none of these proved to have a substantial impact on student learning. The 2012 Law of Teacher Career form was also enacted and established eight levels of salaries for teachers but had little to offer to support teachers or strengthen the infrastructure of the education system. The policy also failed to provide incentive for teachers to instruct in rural classrooms, further marginalizing the schools that needed the most support.
Are there other solutions?
They trained the teachers! Initially, a variety of barriers made accessing university difficult for aspiring instructors. Cue Peru’s substantial economic growth. The country’s GDP grew each year between 2001-2011 allowing the government to invest more into public education and meet the increasing demand for access to classrooms. The Peruvian Ministry of Education created Pedagogical Institutes that were aimed at training teachers, increasing public respect for the occupation, and incentivizing more professionals to teach in rural areas. These institutions incorporated newer teaching styles. Universities also started to offer certificate programs for students who couldn’t access a full degree.
Several initiatives also were started to support teachers, especially those in rural areas. The Quality of Rural Education Improvement project targeted rural schools by bolstering support and offering extra services to teachers. Countries outside of Latin America jumped in as well. The Canadian International Development Agency funded the Teacher education project which also trained teachers. Finally, a Strategic Learning Achievement Program was also established in order to monitor and evaluate these reforms that were implanted in the educational system.
So teachers are trained and quality is high. Problem solved?
The 94.7% doesn’t tell the whole story. UNESCO reported the following limitations in a report from 2014.
1. Teachers aren’t being trained in the mother tongues of indigenous students which has been problematic for students in rural areas.
2. Outside funders and organizations who create and provide trainings are doing so in English.
3. The training statistics do not reflect teacher attendance. The teacher absence rate was 21% and only 59% of class time was actually used by the teachers. Attendance of teachers is also particularly poor in rural areas where teachers travel to larger cities to get errands done.
4. Teachers are still poorly paid and not supported in the classroom.
5. Principals and teachers in State-run schools are not allowed to make decisions such as what textbooks to use or what teachers to hire or let go.
6. Gender-sensitive teaching is not commonly included in the curriculums for teacher training.
7. Rural areas still struggle to draw in teachers leaving the students behind in education.
8. Not at trained teachers can find a job depending on where they live.
9. Sometimes teachers are hired last minute and do not have time to prepare for the semester properly.
What does 94.7% mean for education quality in Peru?
Peru’s education system has greatly benefited from their growing economy. Public investment resulted in more services and resources for both students and teachers. Teachers are learning how to engage their students and create meaningful lessons. According to the Borgen Project, in 2014, the literacy rate was 90% and the attendance rates of students was continuing to improve. The numbers show progress. However, the 94.7% doesn’t tell the whole story. UNESCO reported that there were still notable margins in learning between girls and boys, students of various socioeconomic classes, and urban and rural schools. Some of these margins have grown despite the increase in teacher trainings. The limitations mentioned above demonstrate the need for further support in how to reach all students. Peru has taken great strides to support teachers but there’s more work to be done.
“Except that Which Makes Life Worthwhile” SDG 4.5.4 and the Limits of Measuring with GDP

Mr. Kennedy Goes to Kansas
On March 18 1968, Robert F. Kennedy spoke extemporaneously about why he wanted to be president to an audience at the University of Kansas. At the time, his words about Vietnam, civil rights, and student protests garnered the most attention, but his thoughts about the gross domestic product are what continue to reverberate today:
“Yet the gross national product* does not allow for the health of our children, the quality of their education or the joy of their play… It measures neither our wit nor our courage, neither our wisdom nor our learning, neither our compassion nor our devotion to our country, it measures everything in short, except that which makes life worthwhile.”
Looking at the data in UNESCO’s Global Education Monitoring Education Progress tool, it is clear that while GDP and ratios may help us to compare countries, it obfuscates the daily reality for people around the world as they strive towards education. National balance sheets might give us an idea of how countries value education, how governments and citizens share the burden, but are unable to provide important information about the quality of that burden.
SDG 4.5.4
The goal of SDG 4 is to ensure equitable education for all. One way that United Nations measures this is indicator 4.5.4 which measures the percentage of household income devoted to education.

The first measure helps researchers to understand how each nation prioritizes education and whether or not its education efforts are effective. Higher expenditure may indicate a higher emphasis on education. When household expenditure equals or exceeds the governments, it may indicate inadequate government education provision.
The second measure allows researchers to compare countries regardless of the size of their economies and reveals who is really responsible for providing the resources for education.
The UN is primarily concerned with this data in low and middle income countries. When the majority of a countries population lives at the margins, more families and individuals are forced to engage in a problematic calculus: devote money to education as a long-term investment or redirect it toward more pressing needs like food and shelter?
The SDGs assume that governments can remove education’s luxury price tag by increasing their share of education spending relative to households. In a high income country like the US, however, a higher percentage of government spending does not necessarily equate to less hardship. GDP is only a measure of consumption and does not adequately reflect additional challenges citizens face in securing a quality education.

The University of California system is a venerable, well-resourced, and productive institution. World-renowned, the UC system’s 10 campuses employ more than 220,000 people and educate more than 280,000 students. Their resources include Nobel-prize laureates, 5 medical centers, and 3 national laboratories. In 2019, it generated over 40 billion dollars for the California economy. For every $1 of research funding, the system secures an additional $7 in federal and private funds. Despite these tremendous resources, however, graduate students at UC Santa Cruz have been on a wild cat strike since December 9, 2019 in hopes of securing a cost of living adjustment.
According to the UNESCO data, US education expenses are split 80/20 between the government and households. GDP assumes spending falls into discrete, easy-to-categorize expenses, but a closer look at the UCSC students reveals that the lines are blurred. When almost 100% of expenses go towards supporting life as a graduate student, couldn’t all of those expenses be categorized as education expenses?
GDP can only capture what people spend on, not what motivates them to spend or the quality of that spending. It does not tell us anything about students potential financial poverty or “the poverty of satisfaction—purpose and dignity” that accompany the daily struggle to make ends meet.
Other Measures
Economists have often discussed GDP’s shortcomings and have attempted to come up with new measures that better reflect the social and ecological conditions in countries around the world. The Human Development Index, Gross National Happiness, and Genuine Prosperity Indicator are just a few new measures that attempt to reckon with the poverty of satisfaction, but still have not managed to displace GDP.
Although the US spends a tremendous amount on education, it does not mean that it is adequately funding education. Measures like SDG 4.5.4 can misrepresent how advanced a country is when it comes to supporting its students and families. Until we find a more adequate measure that reflects the problems households face, students will continue to struggle against the supposed health of their nation’s balance sheets.
While there may be a long struggle ahead, perhaps one day colleges will “breed men [sic] who riot, who rebel, who attack life with all the youthful vision and vigor” because of their policies, not in response to them. In the meantime, as RFK quoted William Allen White “the more riots that come out of our college campuses, the better the world for tomorrow.”
Sourcing
Chang, E. (2020, February 26). Join or Die Slug. Retrieved from https://payusmoreucsc.com/gallery/
Kennedy, R. F. (1968). Remarks of Robert F. Kennedy at the University of Kansas, March 18, 1968. John F. Kennedy Presidential Library and Museum, http://www. jfklibrary. org/Research/Ready-Reference/RFK-Speeches/Remarks-of-Robert-F-Kennedy-at-the-University-of-Kansas-March-18-1968. aspx.
Kubiszewski, I. (2014). Beyond GDP: are there better ways to measure wellbeing?. The Conversation, https://theconversation.com/beyond-gdp-are-there-better-ways-to-measure-well-being-33414
Oseni, G., Huebler, F., McGee, K., Amankwah, A., Legault, E., Rakotonarivo, A. (2018). Measuring Household Expenditure on Education. World Bank, http://surveys.worldbank.org/sites/default/files/publications/5_Guidebook_text_July15_web.pdf
Oxford Poverty & Human Development Initiative. (n.d.). Bhutan’s Gross National Happiness Index. University of Oxford, https://ophi.org.uk/policy/national-policy/gross-national-happiness-index/
Pay Us More UCSC. (2020). Campaign Timeline. https://payusmoreucsc.com/campaign-timeline/
UNESCO. 2020. GEM Report Education Progress. [online] Available at: <https://www.education-progress.org/en/articles/finance/>
United Nations Development Programme. (n.d.) Human Development Index. http://hdr.undp.org/en/content/human-development-index-hdi
University of California. (n.d.). The UC System. https://www.universityofcalifornia.edu/uc-system
Okamodo, Y. (Photographer). (1964, January 28). Robert F. Kennedy, Cabinet Room, Washington D.C. [digital image] Retrieved from https://commons.wikimedia.org/wiki/File:Robert_F._Kennedy_1964.jpeg
Yuvali, A.F. (Photographer). (2020, February 10-14). UCSC Picket, Week 1 [digital images] Retrieved from https://www.easybib.com/guides/citation-guides/apa-format/how-to-cite-a-photo-digital-image-apa/
¿Qué pasó?: Why Guatemala’s Poorest Children Aren’t Finishing Primary School

As I walk down the familiar stone streets full of market vendors selling their fresh produce and handmade goods, a smile that I haven’t seen in a year shines from across the street. Maria, an 11 year old indigenous Maya girl living in San Lucas Tolimán, Guatemala, embraces me and greets me with the obligatory, “¿Como está?” I respond and ask her how school is going. “Alex, lo que pasa es que…” With these words I know what is coming. Maria is no longer attending school. She explains to me that she felt she wasn’t learning and didn’t feel supported by the teachers and staff at her school. Her family is also suffering financially, and therefore felt her time was better spent helping her mother sew and weave goods to sell at the market.
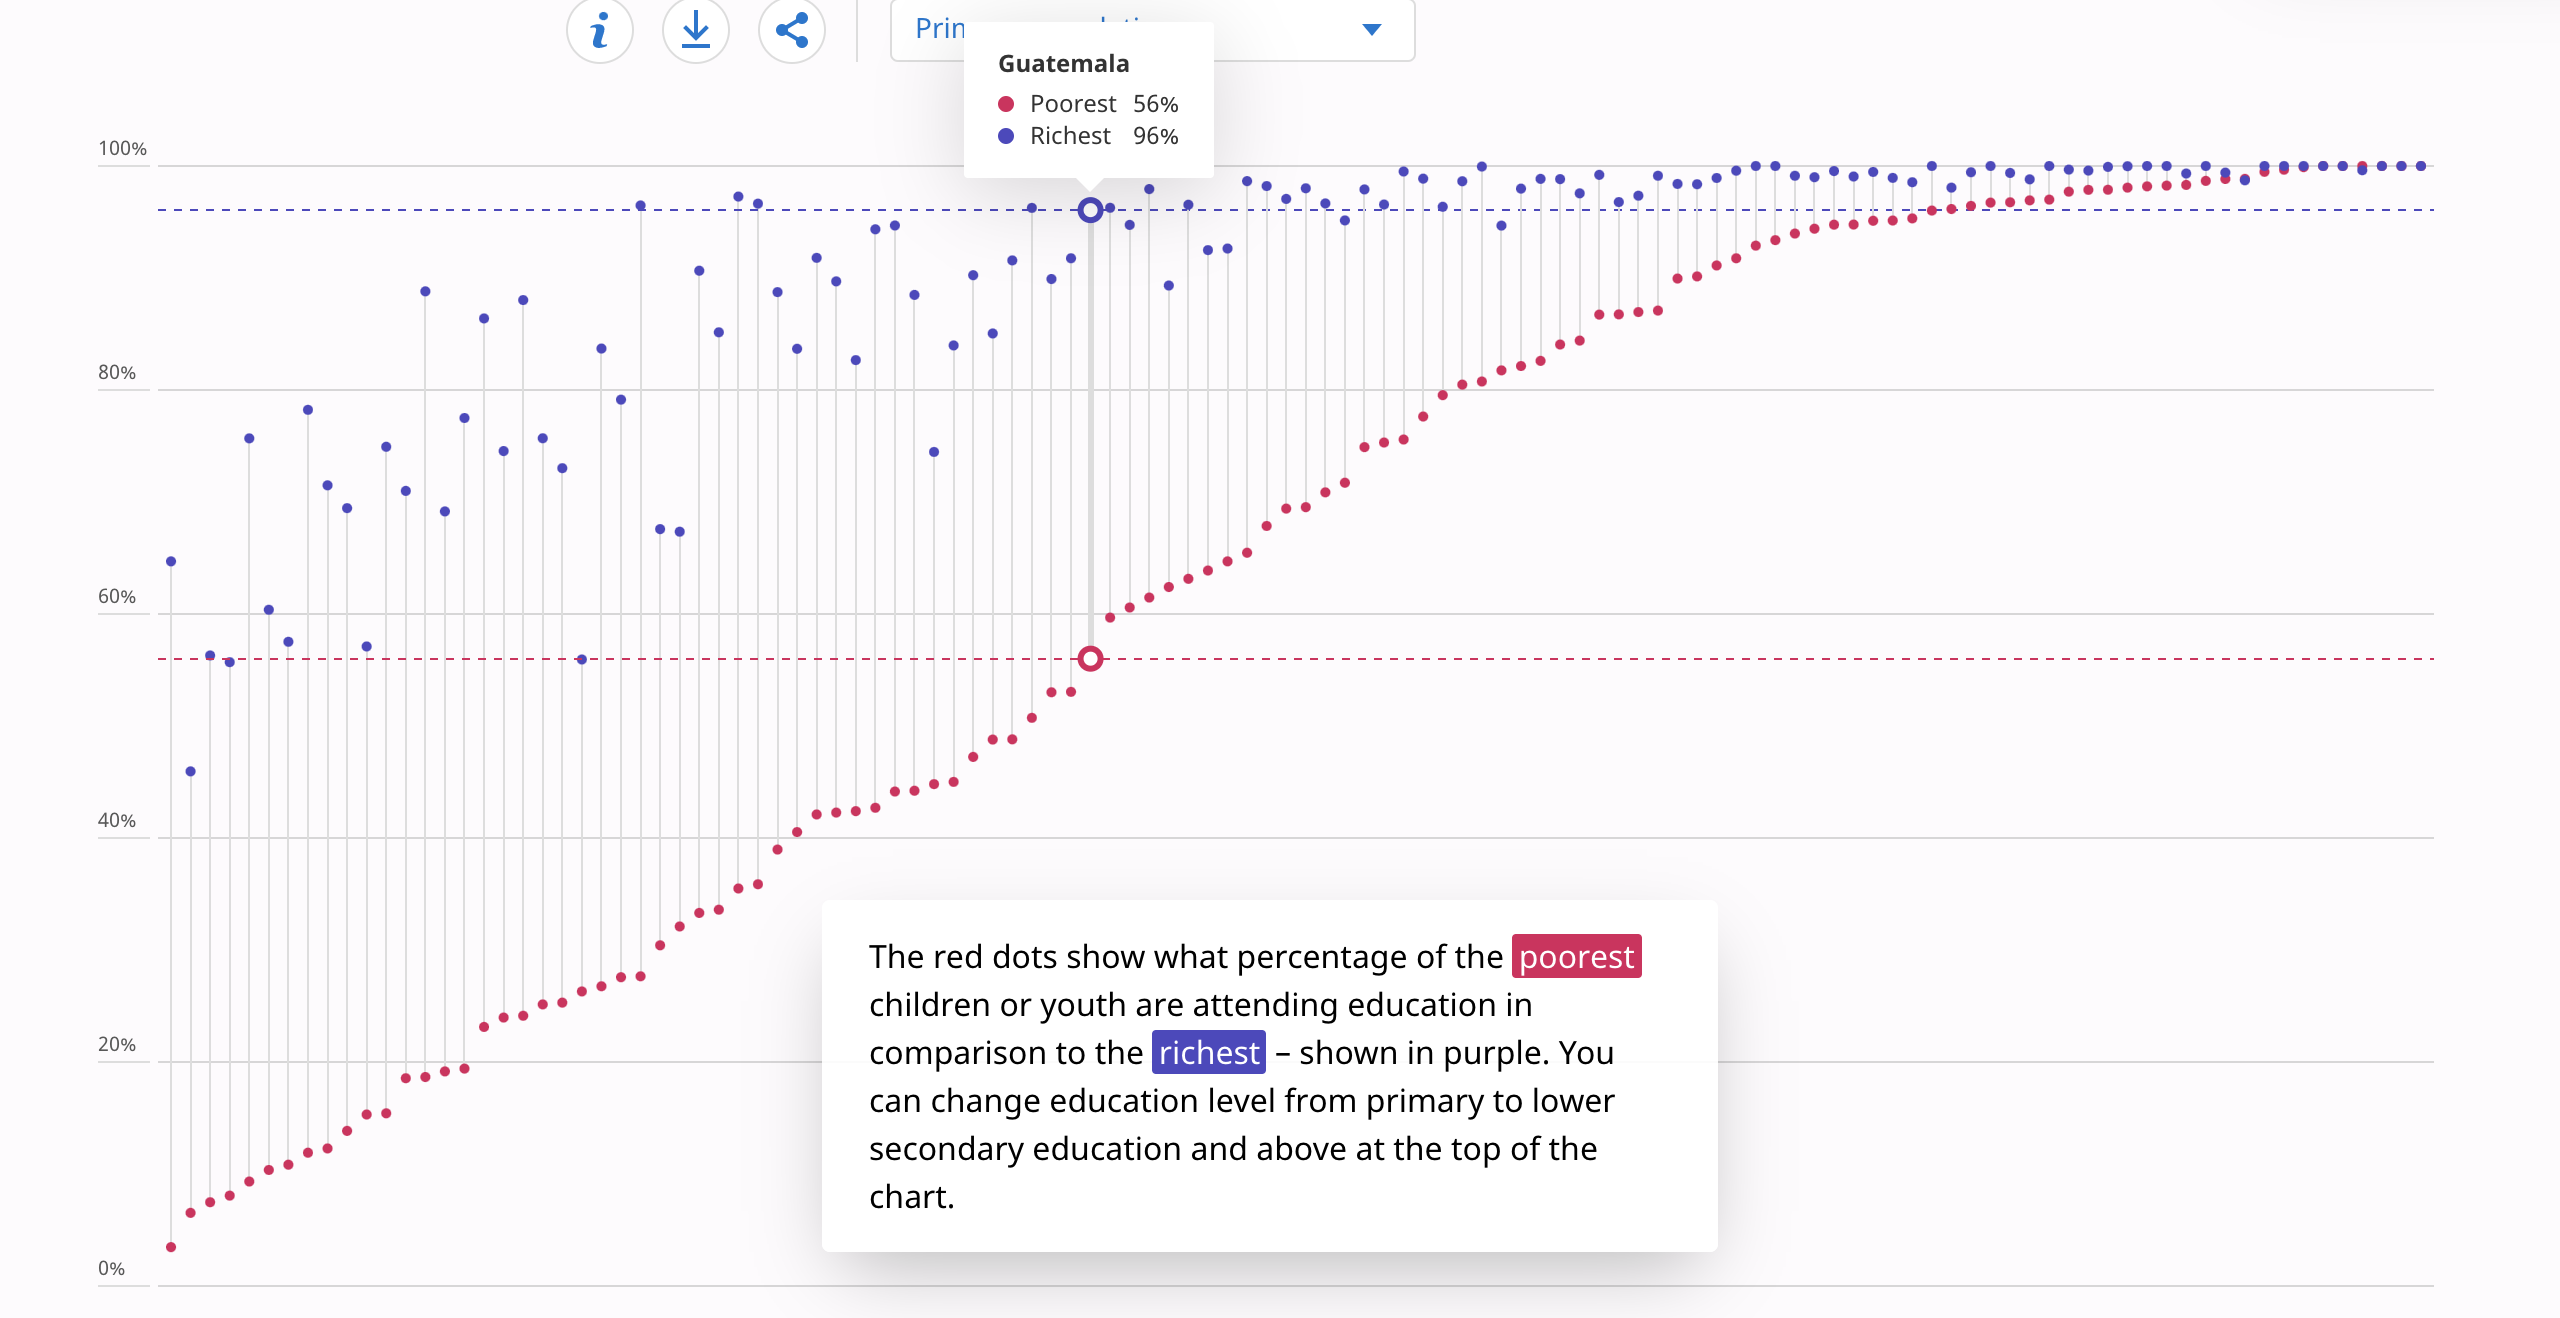
Unfortunately, Maria’s story is not unique, especially among the indigenous population in Guatemala. While school completion rates, particularly in primary school, have increased in Guatemala, there is still a long way to go and socio-economic status still plays a large role in school completion. According to UNESCO, the primary school completion rate for Guatemala’s “richest” is 96%, while the completion rate for the “poorest” is 56%.
While there is little detail given regarding these numbers such as what average income constitutes “richest” and “poorest” nor what ethnicities are present in these groups, based on countrywide statistics, it can be assumed that the majority of those that fall into the “poorest” category are part of the indigenous population. To this day, indigenous children in Guatemala face much more difficulty accessing and completing their education.
According to a document laying out education goals and strategies published by Guatemala’s Ministry of Education, the main objective for this school year is education quality, equity and inclusion. However, within this document, there is no mention of expanding education access to reach the indigenous population. Instead, it addresses ways to improve education quality and ensure students are hitting specific learning objectives. While also important, the Ministry of Education appears to completely ignore two of their main goals – equity and inclusion.
Regardless of their goal, further investment in students and education initiatives will be necessary to create any lasting change. However, over the past 5 years, Guatemala’s government budget being allocated to education has remained stagnant at between 2.8 and 2.96% of GDP. Despite the Ministry of Education’s call for improvement, the government budget does not reflect a commitment to education development within the country.
Progress seemed to be initiated in 2015 when Guatemala, along with 192 other countries, agreed to work towards 17 Sustainable Development Goals (SDG). SDG 4 calls to “ensure inclusive and equitable quality education and promote lifelong learning opportunities for all.” While the language from Guatemala’s Ministry of Education echoes this sentiment, there is little detail on what specific actions will be taken to advance education opportunities for Guatemala’s vulnerable populations, especially the indigenous Maya.
With a history of indigenous discrimination and a 36 year civil war ending in 1996 that wiped out over 150,000 indigenous Maya Guatemalans, incredibly intentional steps and investments are needed to ensure education equity among Guatemala’s children. The government and organizations will need to work together and use a collective approach to create change. The Ministry of Education, while on the right track mentioning equity and inclusion, needs to ensure they are including accessibility for the indigenous population in their goals. The government needs to break out of its stagnant investment and increase its budget for education. Finally, the government, Ministry of Education and other organizations working towards education equality in Guatemala should use the SDG’s as a guideline to inform their work.
Children like Maria should never have to make the choice between going to school and helping their family earn money. With a true commitment and intentional steps taken towards inclusive education, children like Maria will never have to make such a decision.
__________________________________________
References
Equity. (2020). Global Education Monitoring Report. UNESCO. Retrieved from https://www.education-progress.org/en/articles/equity/
Guatemalan Ministry of Education’s Strategy to Improve Education. (n.d.). Guatemala City. Retrieved from http://www.mineduc.gob.gt/portal/documents/estrategias/Estrategia_de_calidad_a_medios.pdf
Sustainable Development Goals Knowledge Platform. (n.d.). Retrieved from https://sustainabledevelopment.un.org/sdg4
Sustainable Development Goals Officially Adopted by 193 Countries. (9AD). Retrieved from http://www.un.org.cn/info/6/620.html
Timeline: Guatemala’s Brutal Civil War. (2011, March 7). Retrieved from https://www.pbs.org/newshour/health/latin_america-jan-june11-timeline_03-07
UNESCO Institute for Statistics – Guatemala. Retrieved from http://uis.unesco.org/country/GT
The World Factbook: Guatemala. (2020). Retrieved from https://www.cia.gov/library/publications/the-world-factbook/geos/print_gt.html