Although I attend and work at the Monterey Institute of International Studies, all the views expressed on this site and in podcasts are my own. Although I'd love to think that I speak for many of the amazing students, faculty, and staff that we have on campus.
For this week’s Green Rant, I will be talking about climate change as a conflict multiplier. Before listening, I suggest you read this little primer about climate change and conflict:
It has been scientifically proven that CO2 causes warming, this was even confirmed by Mythbusters. Humans have been emitting a LOT of CO2 since the start of the industrial revolution, this was also proven by science. As we speak, the concentration of CO2 in the atmosphere is increasing, and has been increasing for years. Global temperatures are increasing, the ocean is absorbing even more of the heat change (which will be a different rant). If you are interested in logic, the argument is as follows: Humans are causing the increase in CO2. The increase in CO2 is causing global temperatures to rise. Therefore, humans are causing global temperatures to rise. There are probably 100 denialist theories as to way this is not the case, but they probably aren’t listening. The result is climate disturbance. I prefer to use this phrase over climate change because the climate has always (and will always) change, and this phrase implies that something is no longer right or natural.
The term conflict has many meanings and definitions, as any Conflict Resolution student would tell you. The most simple model to describe environmental conflict is: increased population + less natural resources = more conflict. Each of these three categories can be expanded to include quite a few more variables. The population includes demographics (migration, youth bulge, population density, growth rate, population size, gender, government type) as well as the impacts of supply and demand. The specific resources that are decreasing impact the conflict as well (water, food, forests, fisheries, etc.). The conflict can even be violent or nonviolent, can involve state and/or non-state actors, can be interstate or intrastate, and can be an existing conflict or a new one.
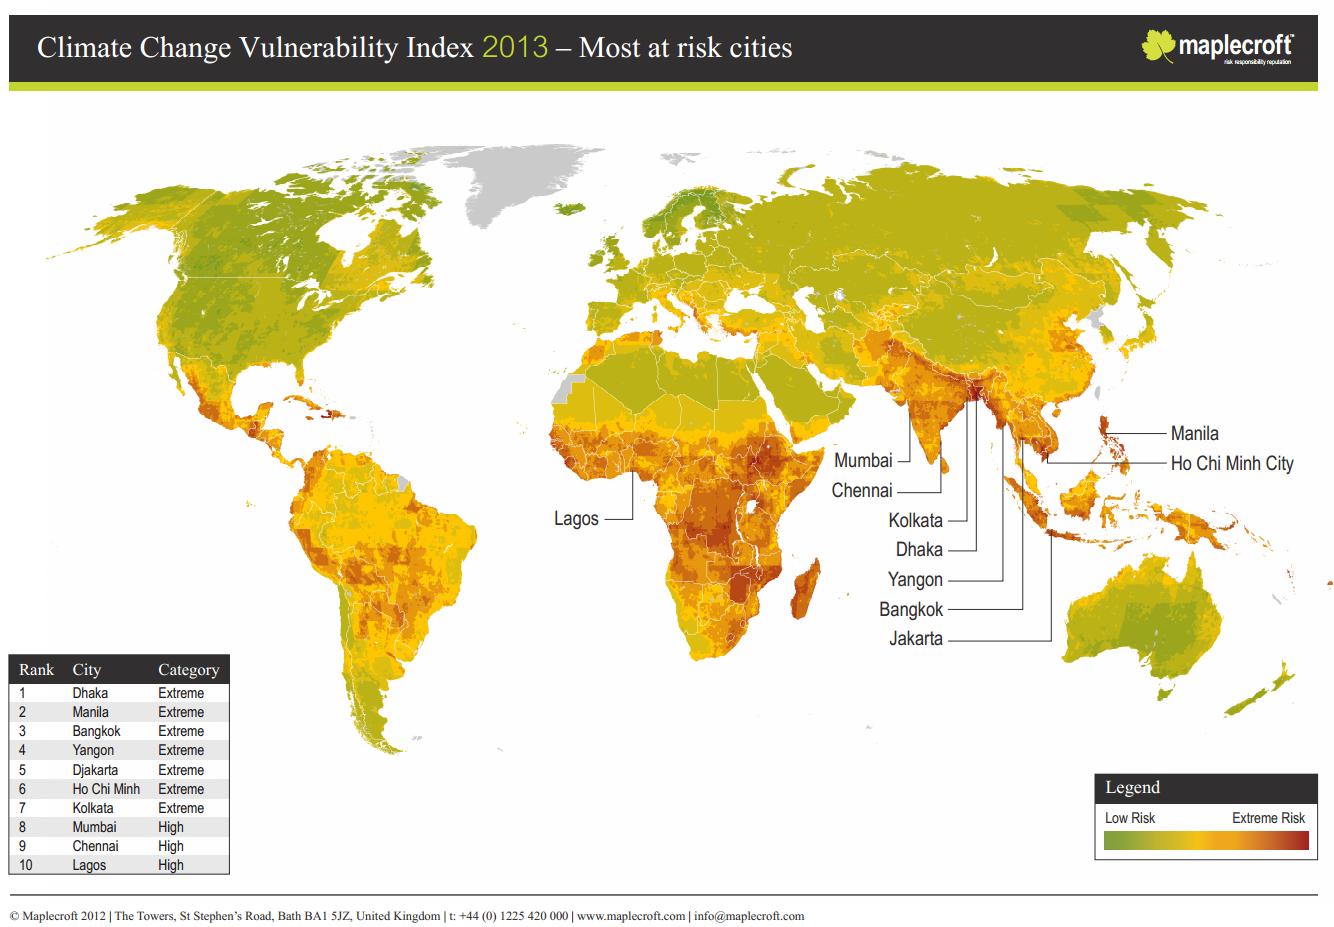
Essentially, with the added variables, one can see that conflict will not impact everyone in the same way. For example, there will be plenty of agricultural destruction from increased temperatures in the middle of the United States, but being a developed country with money can mitigate some of this vulnerability. Since a picture is worth a thousand words, I’ll leave this map below for you to reflect upon till Monday.
This map is part of Maplecroft’s Climate Change Vulnerability Index (CCVI), which forms a central pillar of the Maplecroft’s 5th annual Climate Change and Environmental Risk Atlas. The map ranks the 10 cities which are most at risk.
Let me know if there is any topic you’d like to hear about, event’s you’d like me to mention, or people you’d like to hear interviewed (including yourself). I can’t get enough of this!
Preview:
What’s What – Getting into the groove of things
Green Rant – Climate stressors and conflict
Student Interview – President of Gay & Co and ridiculously nice guy, Bryan Weiner
MIISRadio Connect – Seriously, I know you want to take a crack at podcasting.
In order to rant about Fukushima and the radioactive mess that is occurring the Pacific Ocean, it is important to understand the nature of radiation, the benefits (or issues) with maps, and the nature of the problem. In March of 2011, an earthquake struck off the coast of Japan and the resulting tsunami overwhelmed the seawalls. During the earthquake the Fukushima Dai-ichi nuclear plant lost outside power and faced degraded safety systems. The tsunami then hit, resulting in explosions in 4 units of the facility, 1 of which was never able to achieve cold shutdown, i.e. it continues to leak radiation. Part of the issue is that the facility had noticeable safety flaws that were never addressed, but the unpredictable nature of natural disasters was the main issue. Recentnewsarticles have begun to highlight the new high levels of radiation leaking from the plant.
This NOAA map represents the height of the tsunami wave that swamped the Fukushima Dai’ichi nuclear plant in 2011, NOT the extent of radiation flowing outward from the spill.
While researching for the Green Rant this week I had to give myself a thorough refresher over radiation and its impacts on people and nature. Radiation is complex and one could spend their entire life studying it and still not understand it. There are a few terms that need clarification to understand the issue unfolding in Japan. First is the peach amount of radiation from the plant of about 2,200 millisieverts/hour. Sieverts (Sv) are a measure of the biological impacts of a radiation dose. For example, there are about 2.5 mSv/year of typical background radiation from natural sources and one sievert carries with it a 5.5% chance of eventually developing cancer. The next term is the amount of radiation that will reach the CA coastline (and is being diluted throughout the Pacific) of 10-20 becquerels/cubic meter. Becquerels (Bq) are a measure of radioactive decay and have no implications on biological impacts. Radiation, in the form of cesium-137 and strontium-90 (the isotopes radiating from Fukushima), have similar properties to potassium and calcium respectively. This means that they are able to bioaccumulate in in cells of animals and in bones (again respectively).
A major issue with the fallout of Fukushima is the maps that are being distributed on the internet. The map to the right has been used to demonstrate the radiation in the Pacific. The map actually displays wave height from the tsunami and not radiation. As mentioned, there is a trace amount of radiation that will reach the west coast of the US (and all of the Pacific) that is better demonstrated in a series of maps found here.
The biggest concern right now is that we are now unable to eat fish in the Pacific due to the radiation. Technically, the levels are not high enough to have serious health impacts. I would be more concerned about the sustainability concerns and the mercury levels.
Did anyone else have as much fun as I did with the music? Recording and editing took much less time than the last. Share this with your friends and don’t be afraid to criticize me, as long as it is constructive!
Preview:
What’s What – Student Council elections!
Green Rant – What the Fukushima?
Student Interview – Global Majority Office Manager, club President, and Chile fanatic Sydney Bern-Story
MIISRadio Connect – Do I have to start finding people on campus?
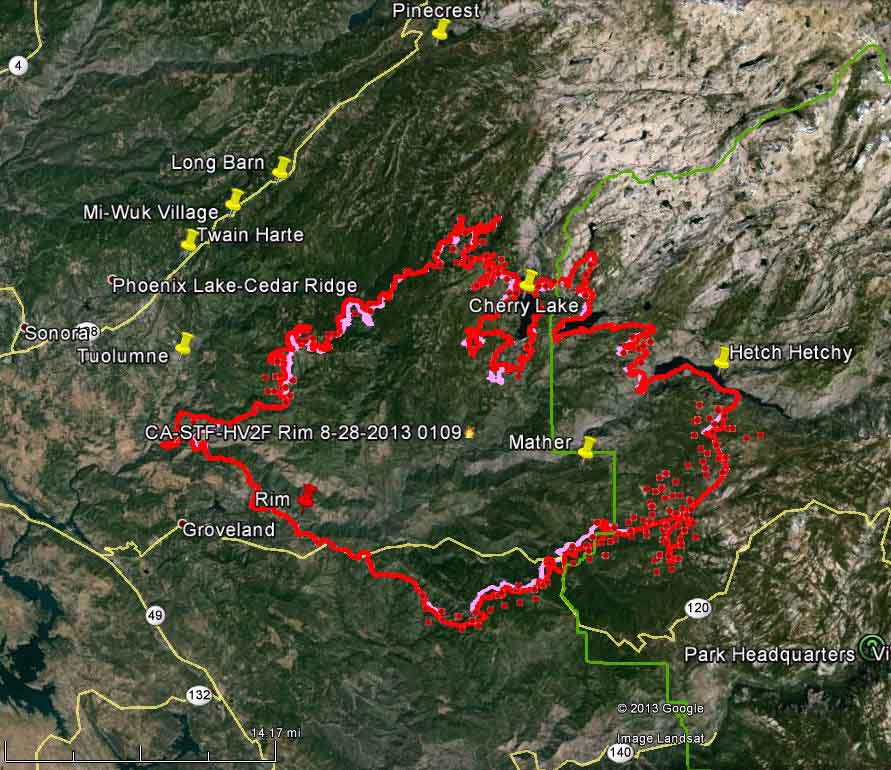
So for next weeks Green Rant I will be talking about the Rim fire that is burning threw Yosemite National Park. More importantly I will be talking about the effects of climate change on wildfires, a phenomenon that has always existed. It has only been recently that wildfires have turned into an insurance nightmare as well as reaching new unbelievable sizes. Before you listen to the podcast there are a few links you should check out.
First is the Fire Tracker, from 89.3 KPCC. This widget has been tracking containment, acres burned, and the impact of the fire on homes/structures. Currently, about 228,670 acres have burned and over 5,000 structures are threatened. What is lacking from this tracker is the current impact on campgrounds in Yosemite, all of which have remained open despite concerns over air quality.
Second is a video that links climate change to wildfires. Like the many other impacts of climate change, it is impossible to say something like “the Rim Fire is the result of climate change.” It is not, however, impossible to say that the higher frequency and intensity of wildfires is the result of a changing climate. Essentially, warming temperatures, prolonged drought, and a century’s worth of fire suppression policy are “priming the system to make it more flammable.”
The last link ties into my GIS class this semester, which is a Perspectives Map. Geographic Information Systems, “lets us visualize, question, analyze, interpret, and understand data to reveal relationships, patterns, and trends.” (ESRI) The series of 4 maps visualize the Rim Fire in an easy to understand way. The critical points of interest and the power/water infrastructure maps relate the importance of containing the fire.
I have faith that the fire will be contained soon with few, if any, casualties. But without addressing climate change, can we say the same for all future wildfires?
I just want to be honest, the first episode took me about 15 takes while recording. I’m not yet use to the way my voice sounds. Let’s see about getting that number down to one take!
Preview:
What’s What – Social hour, StuCo nominations, Activities Fair, MIISion Connect, and a DLC Open House
Green Rant – What’s the deal with wildfires?
Student Interview – Meet your StuCo Executive Board: Ghazal Rahman (Vice President), Jocelyn Rheem (Secretary), Alex Ikeda (Treasurer), Joan Wang (Communications Director)
This is my first attempt at podcasting so I am expecting everything to improve in future attempts.
Episode 1 takeaways:
– I love California
– The new students are eager to get involved
– Sustainability at an international school is tough
– Jessy Bradish is awesome
– The first Social Hour is this Friday, bring a cup, student & government IDs, and a smile!
I’m also going to be expanding this blog a little over the next few weeks. New pages, more blog posts, ways to listen to specific parts of each episode, and much much more.