Key Words / Google Analytics (courtesy of Jill Stoffers)

Thanks for the opportunity to talk with you about how we use analytics in our department. It’s incredibly powerful and has helped me make better / more confident decisions about spending budget and our time.

This is the keyword report that I mentioned. Let me walk through some of the data here. And with both of these, if you have ANY questions or want to see more specifically how I use the data, just contact me and we can set up a time to go over it. We could also brainstorm about how you and your department might use it.

Some general overview

Organic search results: the free (unpaid) ads that pop up when you do a search. These are the best type because they are:

  • Free
  • Users value them over paid b/c they think they are more objective than paid ads.

AdWords: Google’s name for its online ad buying program. When you see them on a search, they say ‘sponsored links’

My goal

Increase our organic search results – or search engine optimization (SEO). Why? It will drive more people to our website, which is our primary recruiting vehicle. I want that when someone types into Google (which has over a 90% global market share for search engines) something like: international MBA programme, that the www.miis.edu website comes up in the first organic position on the search results list. This increases our brand, and hopefully drives enrollments.

How do we do it?

A variety of ways and the way the Google calculates positions changes. Google changes its algorithms as people / advertisers get more savvy about driving clicks to their site. But, there are some tried and true ways to do this that are completely free and within our control.

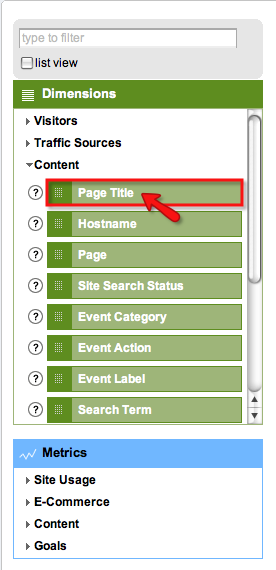
Title tags / page headers – make sure our web pages have clear title tags with terms similar to the search terms a person would use, for example: Master in Translation.

Meta tags- behind the scenes text that can help drive traffic to sites. You can view anyone’s meta tags by right clicking on a page and going to “view” and “source.” You might see a bunch of html code, but you’ll also see what their tags are. I do this regularly to our competitors sites and get ideas for our tags….

Content- (here’s what we can all do) the ‘spiders’ that crawl the web and search sites, read web pages much the same way we would: text that is in the upper right corner, upper left corner or is in bold, italic, or somehow stand out on the page is given more weight. Text that is on top level pages gets more weight. The spiders are trying to match search terms that a user enters with text on the pages. So, if we know that some of the biggest search terms in our category – education – are: MBA, TESOL, ESL etc, we should use those on top-level pages, in tags, and headers.

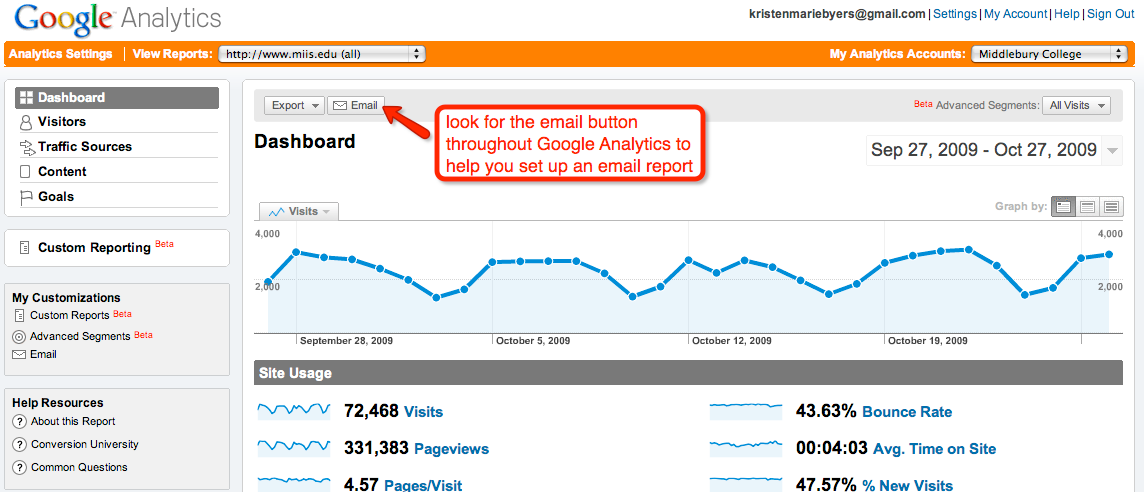
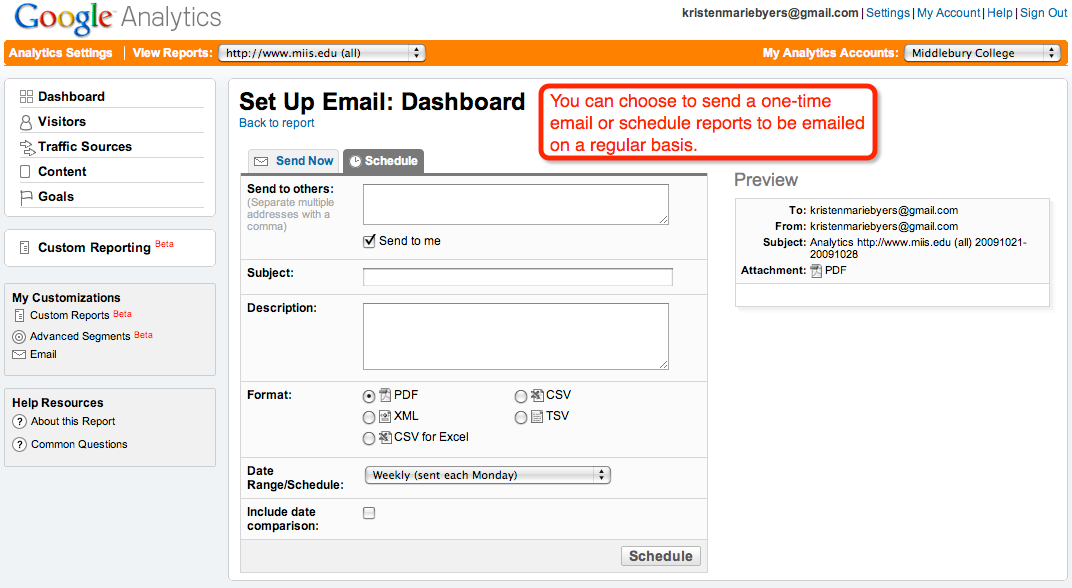
Now on to the report!

We do 2 things with our Google AdWords buying – buy certain key words in Google searches and also buy some key words on specific content sites. You’ll see both in the report – “usnews” is a content site, “study policy” is a key word.

Here’s what the column headers mean:

  • Campaign: which school / programs we’re focusing on
  • Placement / Keyword: the site or keyword we’ve used
  • Match: means that the user has to enter the keyword exactly as shown, if it says “exact”
  • Impressions: how many times our ad was displayed w/ those key words
  • Clicks: the # of times that ad was clicked on
  • CTR – click through rate: percent of clicks to impressions
  • Avg CPC – average cost per click (yes, I have to pay for each click! Some words cost more than others!)
  • Avg CPM – Cost per thousand
  • Cost – total cost for one year to buy that keyword
  • Avg Posit – average position – where did our ad appear? First place, second?

In our case – I think there are two columns that help us determine which keywords are the best:

Impressions – this tells us how many times those search terms were entered into Google in the report period, in this case 1 year. This tells us which are the most active / most used search terms for our ‘category.’ I think this is the most important value in this sheet and the report is sorted that way, in descending order by this field. These are the most used words, and we should try to use them, too.

Clicks – this is important because it helps us determine if our ad copy is compelling enough to get someone to click.

Avg CPC – the cost. You’ll quickly see that some words cost more than others. These values are figured by Google for the entire category and tell us which words they think are the best to use.

Again, improving our organic search results (free!) helps drive applications and, did I mention, they’re free? Let me know if you want me to walk you through ANY of this. I’d be happy to!

Customizing Google Analytics using Advanced Segments

As a continuation of today’s web strategy team meeting, I have discovered how to use Advanced Segments to customize your Google Analytics reports even further. This will help you apply certain features of Google Analytics (such as generating a map overlay) to a specific page or section of the site.

  1. In the left navigation within the Google Analytics dashboard, click “Advanced Segments”.

    Google Analytics: Advanced Segments
    Google Analytics: Advanced Segments
  2. Click “Create new custom segment”.
  3. Drag Content < Page Title into the green “Dimension or Metric” slot.
  4. Google Analytics: Content: Page Title
    Google Analytics: Content: Page Title
  5. Leave the condition as “Matches exactly” and select your Page Title from the Value dropdown menu. Name the segment appropriately and click “Create Segment”.

    Google Analytics: New Segment
    Google Analytics: New Segment
  6. Now you can use the Advanced Segments dropdown menu (top right of the screen as you navigate around the dashboard). Make sure to deselect “All Visits” and select the name of your custom segment before clicking “Apply”.

    Google Analytics: Using a custom segment
    Google Analytics: Using a custom segment

Additional resources

If you’re hungry to learn more about Google Analytics, I found the googleanalytics YouTube channel very useful. Google also has a Google Analytics blog; the “Beginner Topics” category is a great place to start!

Google Analytics: Setting up email reports

  1. Log in to Google Analytics using your Google account credentials. You will see the accounts selection screen (shown below, though yours may differ slightly). Choose “Middlebury College” to continue. (Yes, I know we aren’t Middlebury, but they have centralized Google Analytics for all websites associated with Midd, hence the name.)

    Google Analytics: Accounts Selection
    Google Analytics: Accounts Selection
  2. Once you have logged into Google Analytics and selected the Middlebury College account, you will see these 3 profiles:
    • all = all visitors (everyone who visits miis.edu)
    • midd = visitors from within the 140.233.x.x IP address range (everyone who visits miis.edu from the Middlebury or Monterey Institute campus networks)
    • non-midd = visitors from outside the 140.233.x.x IP address range (everyone who visits miis.edu and is NOT accessing the web via the Midd or MIIS campus networks)

    Google Analytics: Profiles Overview
    Google Analytics: Profiles Overview
  3. Select 1 of the 3 profiles in order to navigate to the Google Analytics dashboard.
  4. Look for the “Email” button throughout the Google Analytics interface in order to set up email reports.

    Google Analytics: Dashboard
    Google Analytics: Dashboard
  5. You can then choose “Send Now” to send a one-time email or choose “Schedule” to have reports sent to you (and/or to others) a regular basis.

    Google Analytics: Set Up Email
    Google Analytics: Set Up Email

What kind of report(s) should I set up?

Create reports that will be useful for you or others in your department. Explore the Google Analytics dashboard to discover which types of information are most pertinent to you. These reports can be simple (ex: the number of visitors to the Admissions section) or more complex (ex: the top referring sites for visitors from each country).

Drop me a line if you have an idea for a report but aren’t quite sure how to make it happen. I will also be detailing some techniques for more complex custom reports in another blog post.

I created a report, now what?

Sit tight and watch your statistics for a few weeks. We can then discuss techniques for improving your section of the site based on these analytics.

Let’s dive in to Google Analytics!

The basics

Okay, so this video is 9 minutes long, but I promise you don’t have to watch all of it in order to get the gist. It’s super helpful if you’ve never looked at the Google Analytics dashboard before (or if you have ventured into Google Analytics but don’t know where to start!).

Dashboard: Settings: Google Analytics

Cool, so how do I set up Google Analytics on my blog?

It’s easy to set up Google Analytics if your blog is hosted on Blogs @ MIIS.

First, you’ll need a Google Analytics account. If you already have a Google account, that will work just fine. Head on over to Google Analytics to get started.

You’ll need to create a new account for your blog in order to get a Google Analytics tracking code. It will look something like this: UA-XXXXX-2

From your blog’s dashboard, navigate to the Settings menu and select “Google Analytics”. Enter your tracking code into the box provided and click “Save Changes”.

Voila! You’re done. Note that it may take awhile for any data to show up in your Google Analytics account, but you’re on your way to analyzing your blog’s traffic!

Sites DOT MIISThe Middlebury Institute site network.