Racial bias in software

Uncategorized
By: Jasmine Wang
Date: May 6, 2021

How Software Can Be Racist?

You may or may not notice that AI has penetrated into our daily life and has been adopted by all walks of life. But AI is not perfect and the technology is not immune to racial bias. Some AI software is programmed to be racist and thus will only worsen the matter instead of improving it.

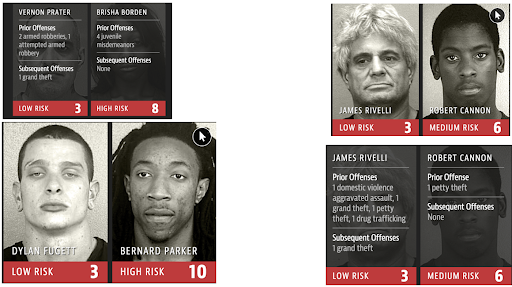
One way for the bias to occur is during the data collection process. The police force has been replacing officer intervention with Predictive Policing Tools to “control” the crime more effectively. The tools predict which areas and which groups of people are more likely to commit crimes or to reoffend after being released from the jail, based on the correlation of the demographics and the crime rate. That leads to a lot of police harassment in black neighborhoods, because the tools indicate that they are more “dangerous”, and unfair sentencing is given to black people, because they are presumed to be repeated criminals.

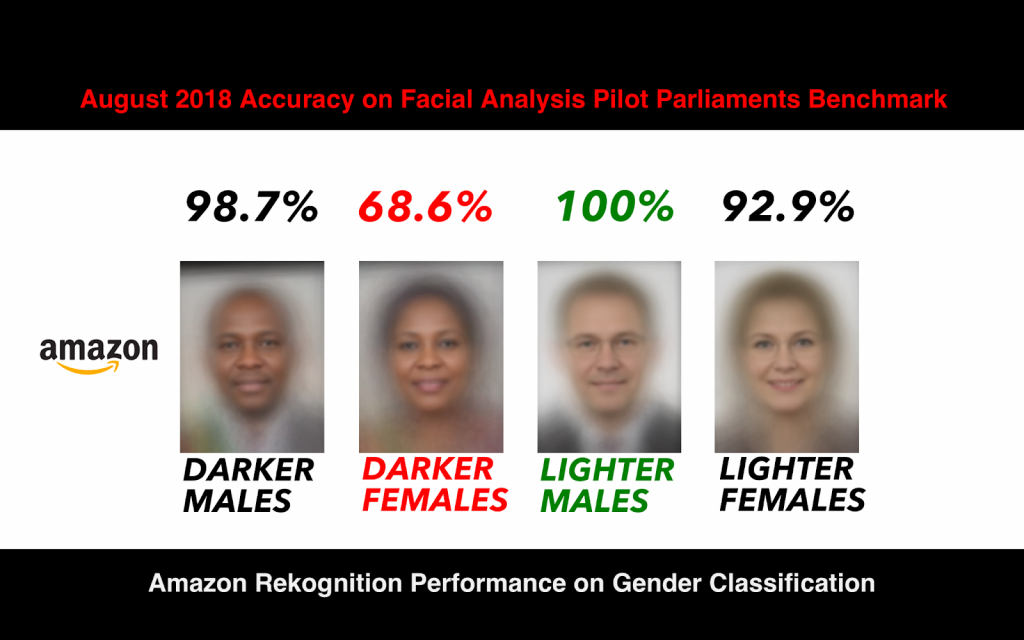
Another way for the bias to happen is when engineers code and design the software.. Tech company workforces are not often known to be racially diverse. Black people have reported that they have a hard time getting the facial recognition software to recognize their faces. It seems easier to recognize Asian and white people. It’s because most of the software developers are either white or Asian, and they build the program based on their own facial structure, often without testing it out on people outside of their races.

Source: https://medium.com/@Joy.Buolamwini/response-racial-and-gender-bias-in-amazon-rekognition-commercial-ai-system-for-analyzing-faces-a289222eeced

How do we combat racist AI?

The good news is that the world is generally optimistic towards technology, especially AI advancement. In order to facilitate the convenience AI can bring to our life, we can take some steps to make our software less biased:

1. Feed the machine with diversified data. Data is the core of machine learning, so in order to improve the machine, we need to start by improving the data. While sorting the training data, we should engage people of different races and design different questions for different demographic groups.

2. Add social science curriculum into the training program for software engineers. Racial equity awareness is as important as coding skills when it comes to creating software. The software should be programmed, from the start,  to serve people of all races.

3. Increase diversity in  the workplace. If the engineer team is composed of people from different racial backgrounds, they will come up with features that make sense to their own cultures and are applicable to their races. That way the software will be all-user-friendly.

Source: https://9to5mac.com/2020/07/28/apple-racial-equity-and-justice-initiative-education/

References

https://www.technologyreview.com/2020/07/17/1005396/predictive-policing-algorithms-racist-dismantled-machine-learning-bias-criminal-justice/

https://towardsdatascience.com/racial-bias-in-software-772d6e949269

https://www.parkersoftware.com/blog/racism-in-technology-how-our-tools-acquire-bias/

Facts Only: Real life impacts of racism

Uncategorized
By: Daniella Saint-Phard
Date: April 6, 2021

Racism persists all around us, whether in education, housing and infrastructure, or healthcare systems. Racial groups face problems on every front. Some of these problems include more police presence, less funding, social interventions, opportunity, and credibility. Data is so important to combatting the everyday issues BIPOC folx face. It is literally a driver of change and we must be responsible with it.


“The PRMR [pregnancy-related mortality rate] for black women with at least a college degree was 5.2 times that of their white counterparts.”

“Cardiomyopathy, thrombotic pulmonary embolism, and hypertensive disorders of pregnancy contributed more to pregnancy-related deaths among black women than among white women.”


Have you ever wondered why pregnant black women fatalities are higher than all other races? Or wondered why women of color in general have higher pregnancy-related mortality rates than white women? These terrifying statistical findings are provided by the CDC. These statistics serve as a tool to illuminate the lived experiences of the BIPOC (Black, Indigenous, People of color) community. How can data then impact BIPOC experiences? It reflects realities and provides insight into areas (variables) of possible change. Throughout data analysis, it is important to be mindful of implicit racism while navigating the method planning, data framing, and historical context.

Based on the CDC’s findings, the following recommendations were made to hospitals and healthcare providers: provide higher quality care, pay closer attention when diagnosing, and learn more about warning signs across different races. The implementation of these recommendations can prevent at least 60% of these deaths and lower the PRMR. 

A glaringly important aspect of data collection, analysis, and presentation is utilizing ethical, responsible, and unbiased language

These recommendations do not address the implicit racial bias faced by black women and other minority groups. Data science and analysis should be for the good of people. As demonstrated in the PRMP statistics, you can have all the numbers, but clear and accurate presentation is equally important. A glaringly important aspect of data collection, analysis, and presentation is utilizing ethical, responsible, and unbiased language. There are three important takeaways from this mini case study of real life data to consider when doing analytic work: methods, framing, and context


Takeaways

Methods

The provided PRMR statistics reflect one aspect of the population, but many other aspects (variables) of life that impact outcomes are not included. It is important to be mindful of reflecting the analyzed population in all stages: planning, methodology, implementation, analysis, and reporting. Tailor data collection methods to your population including, but not limited to, survey design, population sampling, administration/implementation, and monitoring/evaluation.

Framing

The wording of the above reported data can read as accusatory, placing the blame on black women and other minority groups, when in reality the most effective intervention should be implemented by healthcare providers. The wording also includes high-level understanding of medical conditions that the average reader may not immediately understand, which is why it’s important to know your audience. Language is a powerful tool for advocating and presenting data. Check your biases. Peer-review. Communicate openly with the data’s reflected population. Report clear and concise information. Make raw data and findings accessible to affected communities. These are simple habits to develop while dealing with data collection, analysis, and reporting. 

notebook with pen on messy desk

Context

The historical and background context is so important to understanding figures and statistics and applying them in a beneficial and ethical manner. The goal should be to provide a full picture of the situation and the “why” behind data results, rather than reporting data for open interpretation. These reports impact expenditure, planning, and policy decisions that significantly impact life trajectory for many people. When context is not taken into consideration, racial biases and discrimination persists for the BIPOC community.  

In conclusion, data is a powerful undercurrent of lived experiences and gateway to change. Be an ethical and responsible data analysis change driver for not only BIPOC communities, but everyone. That’s it. That’s the message of this blog post.

For more in-depth information on data analysis, visit the META Lab bootcamp course. For more information on the insane reality for BIPOC pregnant women, visit the CDC.gov website.


References

[1] https://www.cdc.gov/media/releases/2019/p0905-racial-ethnic-disparities-pregnancy-deaths.html

[2] https://ocrdata.ed.gov/assets/downloads/FAQ.pdf

[3] https://www.ncbi.nlm.nih.gov/pmc/articles/PMC4194634/

[4] https://www.loyola.edu/academics/data-science/blog/2018/why-ethics-are-important-in-data-science

[5] https://www.cssny.org/news/entry/New-Neighbors

How Big Data Impacts Black Lives

Uncategorized
Written by: Madeleine Smith

March 2, 2021

What is Big Data?

We’ve all spent time on datasets—big, medium, and small. But imagine a dataset so big that you cannot conceptually fit it on any number of screens that you might have in your office. ‘Big data’ refers to datasets that are so colossal they need many machines to process and store their information. These armies of machines are usually linked to cloud platforms that manage them as a single unit. 

Big data is everywhere. It is constantly being collected by companies through our daily actions—hospital trips, energy bills, cell phone and mobile app usage, advertising, and even job applications. One of the attractions of big data is the low cost of collecting it. Many companies and decision-makers will use proxy variables from big data sets to make decisions at scale. A proxy variable is a data category that substitutes immeasurable data (e.g. trustworthiness) with something else (e.g. a credit score based on previous financial behavior). This is where the danger of big data comes in—proxies are prone to losing qualitative context in the ocean of quantitative numbers. This is what author Cathy O’Neil addresses in her book Weapons of Math Destruction: How Big Data Increases Inequality and Threatens Democracy. 

“This is where the danger of big data comes in—proxies are prone to losing qualitative context in the ocean of quantitative numbers.”


What is a ‘Weapon of Math Destruction’?

Besides being a symbolic pun, a “weapon of math destruction”, or a “WMD”, is a harmful algorithmic model for these big data sets. Data models are created by mathematicians and statisticians and they can be encoded with the implicit biases that those mathematicians and statisticians have. This may not seem like a problem on a case by case basis, but when applied at scale to millions, or even billions, of people, these models cause their algorithms to have what O’Neil calls “toxic feedback loops” which reinforce the original bias. These toxic feedback loops disproportionately impact the poor and marginalized while simultaneously reinforcing systemic issues like racism, xenophobia, and poverty. 

WMD’s have three major characteristics that O’Neil outlines in her book: opacity, scale, and damage. O’Neil explains how algorithms used by large companies are shrouded in mystery and heavily protected, sometimes being sold for billions of dollars (e.g. Google’s search engine algorithms). Their opaqueness makes these algorithms dangerous and the companies that use them unaccountable for the consequences their products create. As mentioned earlier, the scale at which WMD’s are used allows them to harm millions of people. An example would be the case of Michelle Rhee. Rhee was hired to increase educational outputs in Washington D.C. and used test scores to judge teacher efficacy with no consideration of the context in which they were teaching. Her approach caused dozens of quality teachers to lose their jobs. 

Some advocates of these secretive algorithms claim that the number of people who benefit from their product or service outweigh those that are harmed. O’Neil rebukes this by claiming that “…the point is not whether some people benefit. It’s that so many suffer. These models, powered by algorithms, slam doors in the face of millions of people, often for the flimsiest of reasons, and offer no appeal. They’re unfair.” It is this level of scale that creates the third characteristic of WMD’s—damage. Toxic feedback loops act as self-fulfilling prophecies for people who happen to fall into the wrong end of the algorithm.

“…These models, powered by algorithms, slam doors in the face of millions of people, often for the flimsiest of reasons, and offer no appeal. They’re unfair.”

There are many different demographic groups that WMD’s negatively impact around the world. This article will be focusing on the inequitable experience of Black Americans in the United States. Let’s take a look, shall we?

Predictive Policing – PredPol

If you haven’t heard of predictive policing, let me enlighten you. Predictive policing is the use of historical crime data within any given police department to utilize officers time and energy efficiently. The theory behind this type of policing is that studying trends of previous crimes will inform the department about potential future crimes. O’Neil points out the unfortunate reality of predictive policing by analyzing the impact of a software called PredPol. She goes on to explain how the software works, saying that “The program processes historical crime data and calculates, hour by hour, where crimes were most likely to occur.” The softwares predictions are presented as squares on a grid system. When a square lights up, police are encouraged to patrol that area on the grid. 

This approach to reducing crime and increasing police efficiency has led to the over-policing of low-income and historically Black neighborhoods. This approach has also opened doors to more invasive police behaviors—standardized stop and frisk (oftentimes accused of being a racist practice) and even taking pictures of civilians to upload to facial recognition software. O’Neil tells us that in New York City alone, 85% of these stop and frisk encounters involved young Black or Latino men, with only 0.1% of those men being linked to any type of violent crime. The reason this becomes dangerous with programs like PredPol is because the model behind the algorithm is based on historical police department data—which is based on the biases of previous police. This data goes back generations—to times when policies like segregation were legal. So the algorithm for PredPol is a prime tool for the toxic feedback loop that leads to over-policing in Black and brown neighborhoods,  arrests of more Black and brown men and women, and more hurdles to overcome.  

For-Profit Colleges

Another example of how big data disproportionately impacts Black people in the United States are the predatory advertising algorithms used by for-profit colleges. Have you ever seen an advertisement on your Google search engine for DeVry University or the University of Phoenix? These for-profit schools use algorithmic models that specifically target vulnerable populations. According to O’Neil, a similar institute called Vatterott College, “directs recruiters to target ‘Welfare Mom w/Kids. Pregnant Ladies. Recent Divorce. Low Self-Esteem. Low Income Jobs. Experienced a Recent Death. Physically/Mentally Abused. Recent Incarceration. Drug Rehabilitation. Dead-End Jobs—No Future.” While O’Neil doesn’t explicitly discuss the racial component of these targets, it’s easy to find if you do a little research. According to the National Center for Education Statistics, Black Americans consistently make up between 12-25% of individuals on welfare. According to The Bureau of Justice Statistics, 38% of state prison inmates are Black. And finally, according to the United States Census Bureau, 18.8% of Black Americans are living in poverty. These numbers may not sound alarming, but when we apply the second characteristic of WMD’s (scale), these percentages equate to millions of people being targeted by for-profit colleges. The colleges are notorious for inflating their program costs to astronomical levels and lack credibility in the job market, leaving graduates with high-interest student loans with little ability to earn a higher income. 

Conclusion

The inequalities of big data are present in many other areas outside of what Cathy O’Neil explains in her book. Racial discrimination is rampant in areas like our healthcare system, facial recognition software, and online hiring platforms (to name a few). The good news is that people are beginning to highlight the inequalities caused by these once unmonitored algorithms. Better yet, they’re working to fix the algorithms that cause such blatant inequity in the first place. Not only do we need more diversity and representation in data science, we need those who are not affected by poverty and marginalization to educate themselves on the needs of others and work to build algorithms that help lift people out of poverty and eradicate systems like racism.