Key Words / Google Analytics (courtesy of Jill Stoffers)

Thanks for the opportunity to talk with you about how we use analytics in our department. It’s incredibly powerful and has helped me make better / more confident decisions about spending budget and our time.

This is the keyword report that I mentioned. Let me walk through some of the data here. And with both of these, if you have ANY questions or want to see more specifically how I use the data, just contact me and we can set up a time to go over it. We could also brainstorm about how you and your department might use it.

Some general overview

Organic search results: the free (unpaid) ads that pop up when you do a search. These are the best type because they are:

  • Free
  • Users value them over paid b/c they think they are more objective than paid ads.

AdWords: Google’s name for its online ad buying program. When you see them on a search, they say ‘sponsored links’

My goal

Increase our organic search results – or search engine optimization (SEO). Why? It will drive more people to our website, which is our primary recruiting vehicle. I want that when someone types into Google (which has over a 90% global market share for search engines) something like: international MBA programme, that the www.miis.edu website comes up in the first organic position on the search results list. This increases our brand, and hopefully drives enrollments.

How do we do it?

A variety of ways and the way the Google calculates positions changes. Google changes its algorithms as people / advertisers get more savvy about driving clicks to their site. But, there are some tried and true ways to do this that are completely free and within our control.

Title tags / page headers – make sure our web pages have clear title tags with terms similar to the search terms a person would use, for example: Master in Translation.

Meta tags- behind the scenes text that can help drive traffic to sites. You can view anyone’s meta tags by right clicking on a page and going to “view” and “source.” You might see a bunch of html code, but you’ll also see what their tags are. I do this regularly to our competitors sites and get ideas for our tags….

Content- (here’s what we can all do) the ‘spiders’ that crawl the web and search sites, read web pages much the same way we would: text that is in the upper right corner, upper left corner or is in bold, italic, or somehow stand out on the page is given more weight. Text that is on top level pages gets more weight. The spiders are trying to match search terms that a user enters with text on the pages. So, if we know that some of the biggest search terms in our category – education – are: MBA, TESOL, ESL etc, we should use those on top-level pages, in tags, and headers.

Now on to the report!

We do 2 things with our Google AdWords buying – buy certain key words in Google searches and also buy some key words on specific content sites. You’ll see both in the report – “usnews” is a content site, “study policy” is a key word.

Here’s what the column headers mean:

  • Campaign: which school / programs we’re focusing on
  • Placement / Keyword: the site or keyword we’ve used
  • Match: means that the user has to enter the keyword exactly as shown, if it says “exact”
  • Impressions: how many times our ad was displayed w/ those key words
  • Clicks: the # of times that ad was clicked on
  • CTR – click through rate: percent of clicks to impressions
  • Avg CPC – average cost per click (yes, I have to pay for each click! Some words cost more than others!)
  • Avg CPM – Cost per thousand
  • Cost – total cost for one year to buy that keyword
  • Avg Posit – average position – where did our ad appear? First place, second?

In our case – I think there are two columns that help us determine which keywords are the best:

Impressions – this tells us how many times those search terms were entered into Google in the report period, in this case 1 year. This tells us which are the most active / most used search terms for our ‘category.’ I think this is the most important value in this sheet and the report is sorted that way, in descending order by this field. These are the most used words, and we should try to use them, too.

Clicks – this is important because it helps us determine if our ad copy is compelling enough to get someone to click.

Avg CPC – the cost. You’ll quickly see that some words cost more than others. These values are figured by Google for the entire category and tell us which words they think are the best to use.

Again, improving our organic search results (free!) helps drive applications and, did I mention, they’re free? Let me know if you want me to walk you through ANY of this. I’d be happy to!

Customizing Google Analytics using Advanced Segments

As a continuation of today’s web strategy team meeting, I have discovered how to use Advanced Segments to customize your Google Analytics reports even further. This will help you apply certain features of Google Analytics (such as generating a map overlay) to a specific page or section of the site.

  1. In the left navigation within the Google Analytics dashboard, click “Advanced Segments”.

    Google Analytics: Advanced Segments
    Google Analytics: Advanced Segments
  2. Click “Create new custom segment”.
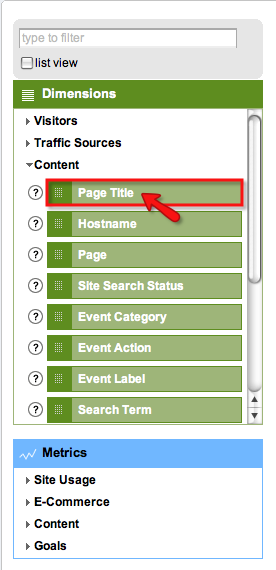
  3. Drag Content < Page Title into the green “Dimension or Metric” slot.
  4. Google Analytics: Content: Page Title
    Google Analytics: Content: Page Title
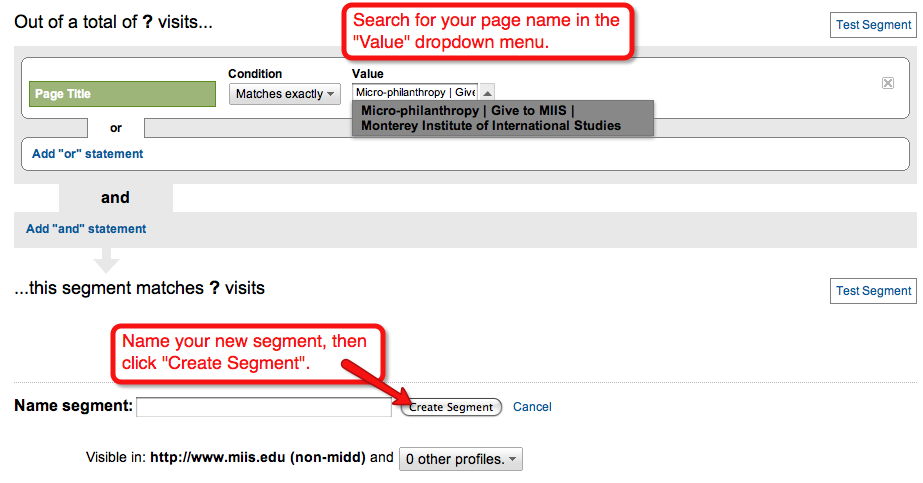
  5. Leave the condition as “Matches exactly” and select your Page Title from the Value dropdown menu. Name the segment appropriately and click “Create Segment”.

    Google Analytics: New Segment
    Google Analytics: New Segment
  6. Now you can use the Advanced Segments dropdown menu (top right of the screen as you navigate around the dashboard). Make sure to deselect “All Visits” and select the name of your custom segment before clicking “Apply”.

    Google Analytics: Using a custom segment
    Google Analytics: Using a custom segment

Additional resources

If you’re hungry to learn more about Google Analytics, I found the googleanalytics YouTube channel very useful. Google also has a Google Analytics blog; the “Beginner Topics” category is a great place to start!

Google Analytics: Setting up email reports

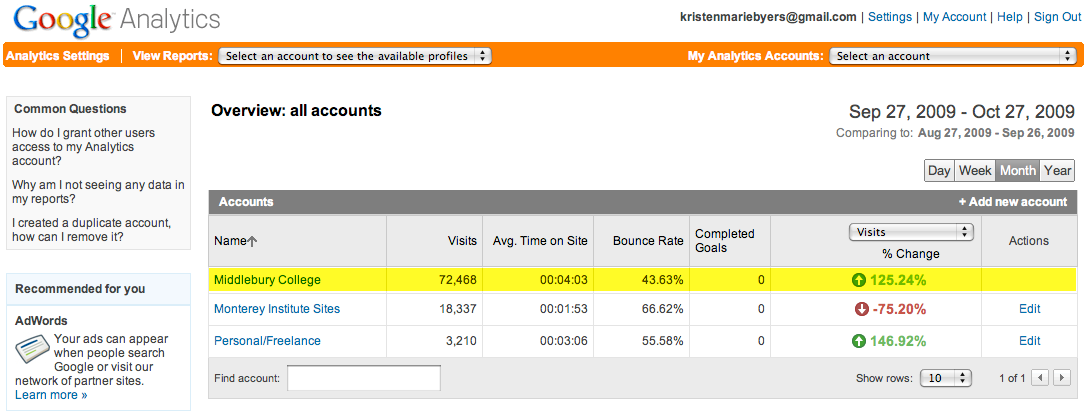
  1. Log in to Google Analytics using your Google account credentials. You will see the accounts selection screen (shown below, though yours may differ slightly). Choose “Middlebury College” to continue. (Yes, I know we aren’t Middlebury, but they have centralized Google Analytics for all websites associated with Midd, hence the name.)

    Google Analytics: Accounts Selection
    Google Analytics: Accounts Selection
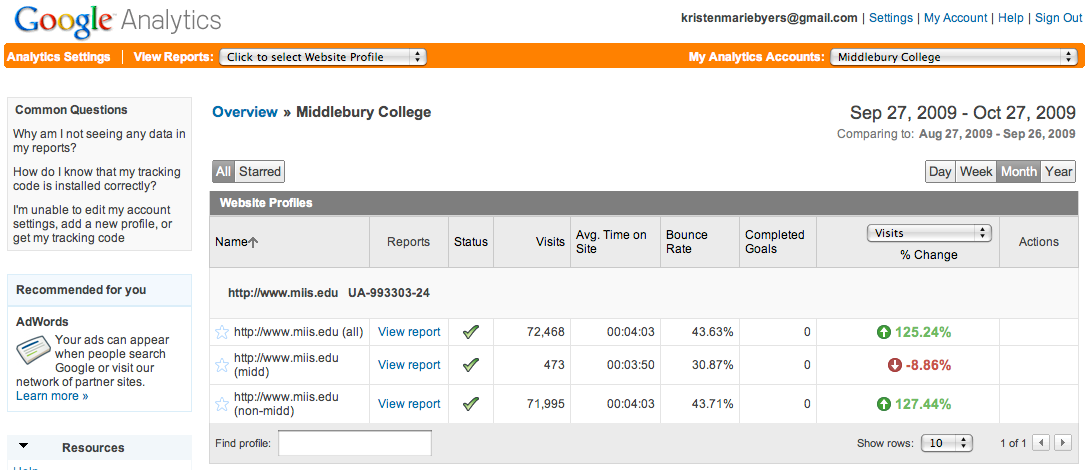
  2. Once you have logged into Google Analytics and selected the Middlebury College account, you will see these 3 profiles:
    • all = all visitors (everyone who visits miis.edu)
    • midd = visitors from within the 140.233.x.x IP address range (everyone who visits miis.edu from the Middlebury or Monterey Institute campus networks)
    • non-midd = visitors from outside the 140.233.x.x IP address range (everyone who visits miis.edu and is NOT accessing the web via the Midd or MIIS campus networks)

    Google Analytics: Profiles Overview
    Google Analytics: Profiles Overview
  3. Select 1 of the 3 profiles in order to navigate to the Google Analytics dashboard.
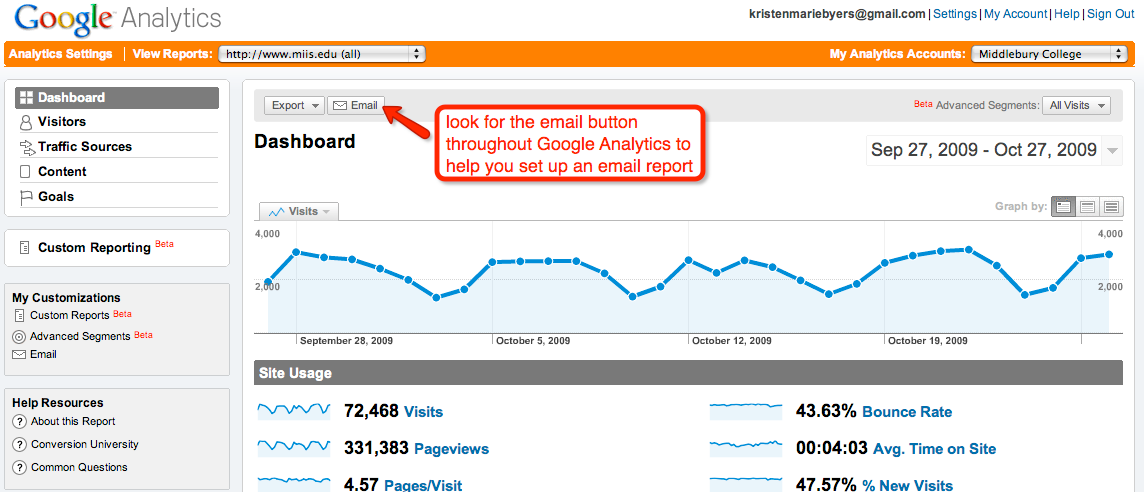
  4. Look for the “Email” button throughout the Google Analytics interface in order to set up email reports.

    Google Analytics: Dashboard
    Google Analytics: Dashboard
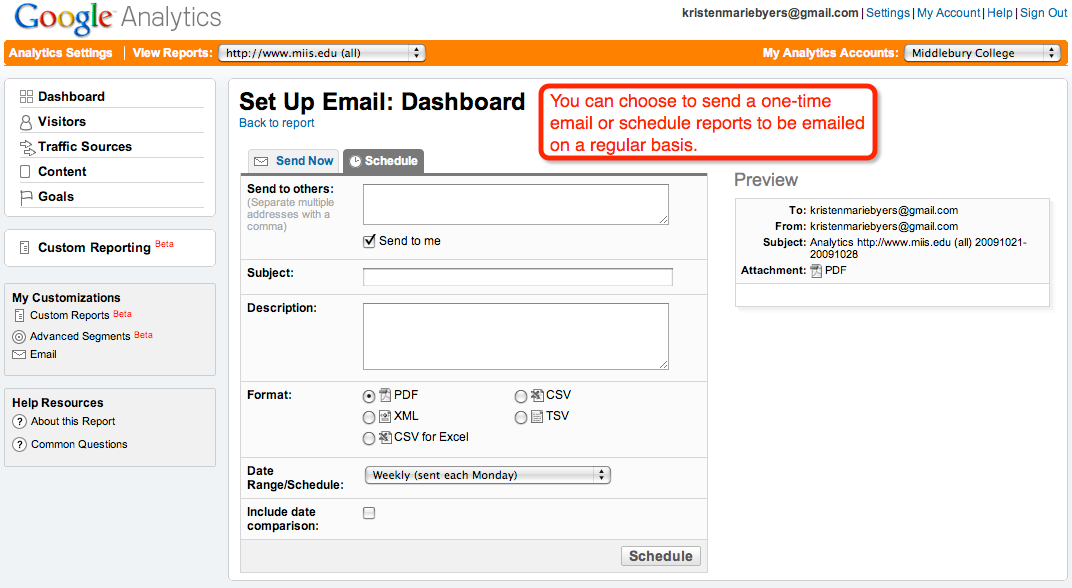
  5. You can then choose “Send Now” to send a one-time email or choose “Schedule” to have reports sent to you (and/or to others) a regular basis.

    Google Analytics: Set Up Email
    Google Analytics: Set Up Email

What kind of report(s) should I set up?

Create reports that will be useful for you or others in your department. Explore the Google Analytics dashboard to discover which types of information are most pertinent to you. These reports can be simple (ex: the number of visitors to the Admissions section) or more complex (ex: the top referring sites for visitors from each country).

Drop me a line if you have an idea for a report but aren’t quite sure how to make it happen. I will also be detailing some techniques for more complex custom reports in another blog post.

I created a report, now what?

Sit tight and watch your statistics for a few weeks. We can then discuss techniques for improving your section of the site based on these analytics.

Let’s dive in to Google Analytics!

The basics

Okay, so this video is 9 minutes long, but I promise you don’t have to watch all of it in order to get the gist. It’s super helpful if you’ve never looked at the Google Analytics dashboard before (or if you have ventured into Google Analytics but don’t know where to start!).

Dashboard: Settings: Google Analytics

Cool, so how do I set up Google Analytics on my blog?

It’s easy to set up Google Analytics if your blog is hosted on Blogs @ MIIS.

First, you’ll need a Google Analytics account. If you already have a Google account, that will work just fine. Head on over to Google Analytics to get started.

You’ll need to create a new account for your blog in order to get a Google Analytics tracking code. It will look something like this: UA-XXXXX-2

From your blog’s dashboard, navigate to the Settings menu and select “Google Analytics”. Enter your tracking code into the box provided and click “Save Changes”.

Voila! You’re done. Note that it may take awhile for any data to show up in your Google Analytics account, but you’re on your way to analyzing your blog’s traffic!

Effective Online Communications

Good Online Engagement: What Is It?

Attract prospects, drive traffice & collect email addresses
Engage involved prospects, interact via web and email
Commit supporters, online action (donation/petition)
Retain committed supporters, personalized web content/email contact

Plan to Succeed

  • Mission-based communications vision
  • Organizational goals
  • Departmental goals
    • Strategic
    • Operational
  • Plans to achieve goals

Example:

  • Strategic goal: provide regular updates to stakeholders
  • Operational offline goal: produce quarterly print newsletter
  • Operational online goals: weekly website content updates, monthly e-newsletter, action alerts as appropriate
  • Include who, why, when how

What is Your Organizational Capacity?

  • Database
  • Established strategies
  • Operations (staff & technology)
  • Time
  • Money

Reflect

Are your goals in balance with your capacity?
Have we articulated our vision & goals?
Wher do we need to improve our organization’s capacity?
What are short and long term changes we could make to improve?

Effective Web Presence

4 C’s of Effective Websites

Credibility

The public face of your organization

Cultivation

Outreach and building relationships
Are we using inviting, engaging language?
Visitors come to your site to learn, then to act

Clickability

Interactive user experience with clear navigation
No matter what, there is no ONE single type of donor
Need to provide different interactive experiences to appeal to the widest variety of audiences possible

Content

THE most important element — requires regular input
What are you doing to create a stream of content (not just text, but images)?
Don’t use all stock images — this hurts credibility and isn’t as personal as in-house photography/organic content
Websites provide multiple levels of information about your work
Who visits our site? Who do we want to visit our site?
Identify 3 audiences, 3 things you want them to know, and 3 things you want them to DO

Top 9 ways to catch supporters

1. Layout – Outside In not Inside Out
Ask yourself:
can our visitors find what they want on our site?
Ask your visitors:
Can you easily find what you are looking for on our site?
Find out:
Usability testing, focus groups, surveys

2. Bring Content Online
what does your org publish? Who do you serve? What do you do? How do you do it?

When you print reports, flyers, invitations, forms…ask yourself:
How will I put this on the website?
How will it be different (editing, graphics, etc.?
Consider statistics, data, downloadable papers, biographical information

3. Collect Email Addresses
Your New Mantra:
I will collect email addresses — everywhere
I will ask permission to email (volume is not helpful if they don’t wish to subscribe)
I will make regular contact

4. Write for the Web
People barely READ websites word for word
They SCAN web sites
They GLANCE at emails

With this in mind, do not write hyperlinks that say “click here” — use the title of the link &mash; hyperlinks need to be like wildfire!

5 top web writing tips:

  1. Highlight keywords
  2. Use bulleted lists
  3. One idea per paragraph
  4. Cut your text in half (then in half again)
  5. Offer links

5. Get Content
You are not alone!
You can get free content from:

  • Partners, collaborators
    • Jointogether.org
    • Alternet.org
    • Care2.com
    • Enature.com
    • Yahoo
  • News feeds
  • Your constituents

Tips:
Identify important “revolving” content
Coordinate the team: think about program content and content management tools
Prioritize
Systematize
Develop a schedule
Delegate

6. Ask and Make it Easy to:
Give a donation
Take an Action
Learn about you
Contribute in other ways

How?
Ask for support or to take action
Give compelling reasons to help or give
Provide secure donation page
Tag line & mission statement
Contact information on every page

7. Privacy Policy
Describes how your org handles information
Informs visitors how you will handle:

  • name/personal info
  • credit card/ donor info
  • email addresses
  • cookies

8. Interactivity
Clicking is a kinesthetic experience, mimics a conversation
The more your visitor can “talk to you, the closer they will feel to your mission
The closer they feel to your mission, the more they will want ot support you
Don’t be afraid to have fun

9. Web Management
To update content easily, you will need someone on board with web skills
Your options:

  • consultant
  • train your staff
  • invest in a CMS
  • all of the above

Reflect

How is this different from our website?
Which of these elements could we try?
What ideas does this generate for me?

Effective email

“Email communications are more important than a website.” mdash; Michael Gilbert, “Gilbert Manifesto”
Exceptions: initial list building/application-focused sites
Combining email and direct mail builds personal relationships
Personal relationships are the heart of fundraising

Four Email Cornerstones

1. Personal
Personalize messages with data (names, amounts, etc.)

2. Targeted
Segment lists and target emails

3. Integrated
Email integrated with web content, direct mail, etc.
Campaigns should be mirrored between website & direct mailings
People who receive a direct mailing may visit the website, will expect to see the same thing

4. Trackable
Seek out and use data about your emails

Six Email Considerations

  1. Respect your subscriber
  2. Email privacy policy
  3. Build the list the right way (one person at a time)
  4. Make a compelling “envelope”
  5. HTML vs. text
  6. Test in different programs, services

Email techniques

  • Hypertext links
  • Word of mouse marketing (viral)
  • Personalized greetings and references
  • Incentives
  • List segmentation
  • Clickthrough tracking

Enewsletter techniques

  • Create glance-able, enticing TOC
  • Establish the brand
  • Content
    • write for readers to scan (subject line/short items/visuals/teasers)
    • create links to longer items on the web
  • Establish timing for newsletter
    • keep to regular schedule: quarterly/monthly/weekly
  • Provide ability to pass the eNewsletter to a friend

Avoiding the SPAM label

  • Ask for and document permission to email online/offline
  • Postal address and unsubscribe option in every email
  • Accurate subject and from lines – no sensational language
  • Establish an email privacy policy
  • Ask stakeholders how frequently they want to receive communications

Basics of Driving Traffic

  • Distinct and succinct URL
  • Your URL everywhere
  • Use word of mouth
  • Links to partners and content
  • Fundraising campaigns and special events
  • Email and enewsletters
  • Paid key words/Google Grants
  • Related newsgroups and listservs

Tracking Metrics

Accurately benchmarks what people really care about
Helps you create and evaluate campaigns

Website Metrics:

  • Unique visitors
  • Most popular pages/stories…and the least
  • Time on site/page
  • Document downloads
  • Keywords
  • Website traffic sources

Email/Enews Metrics

  • Open rate
  • Clickthrough rate
  • Response rate for requested action
  • eNewsleter subscribes/unsubscribes

Reflect

How is this different from our strategies for driving traffic?
How do we track metrics? How might we do it differently moving forward?

Sites DOT MIISThe Middlebury Institute site network.